Change the line style in a Line, Area, or Radar chart, a Cartesian chart, or for a Regression line. Choose from different colors and styles, and show the lines as solid, dotted, or dashed. Changes to the line style can be applied to all lines in the chart, or to selected lines only.
The line style can be set from both the Formatting panel and from the Component Ribbon.
Formatting Panel
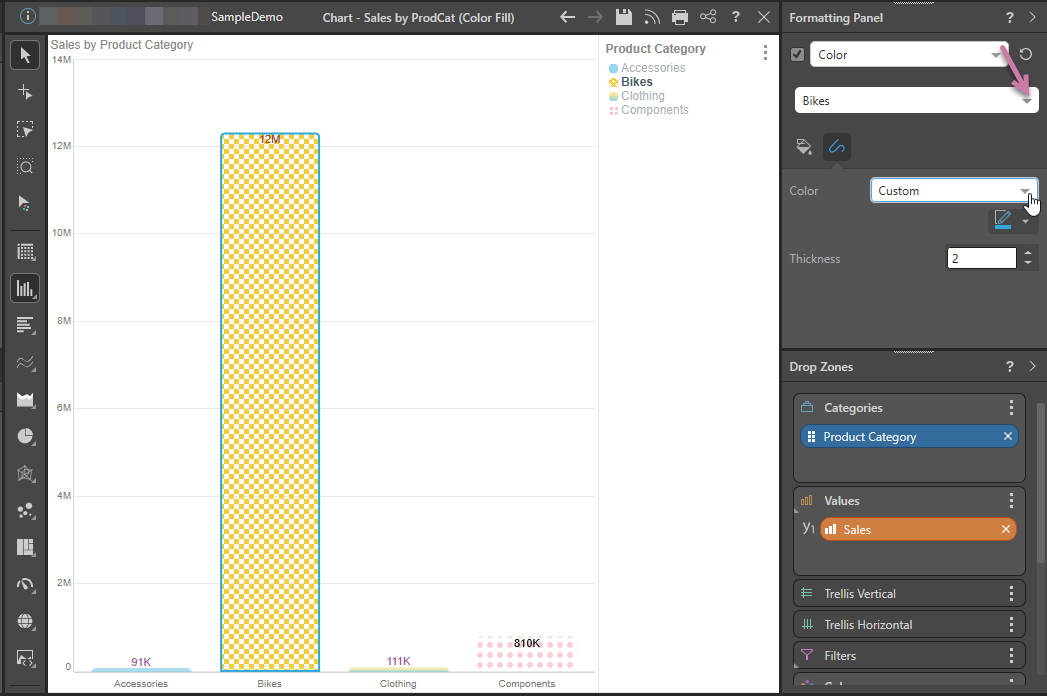
The Line tab is located within the Color view of the Formatting panel.
The Line tab contains options for customizing the line color, width, and style of the line. The Target dropdown list (purple arrow) indicates whether your changes apply "by default" or only to one of the items in the visual (in the following case, to the Bikes column):
The following options from the Line tab are for Cartesian charts:
- Color: Set the color of the line. This option does not appear for line or radar charts.
- Data Point Color: By default, the line color is the same color as the data point.
- Custom: Select a different line color from the color picker.
- Thickness: Change the thickness of the line.
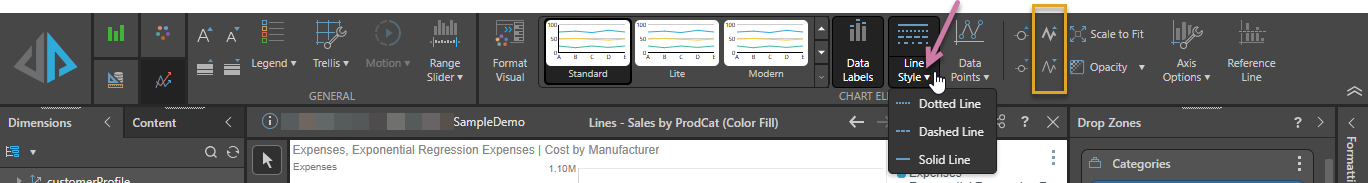
The following options from the Line tab are for line, area, and radar charts:
- Thickness: Set the thickness of the line.
- Line Style: The default line style is solid, but you can change it to a dotted or dashed line.
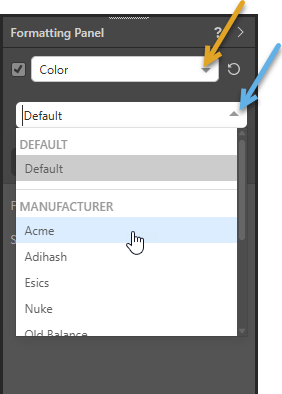
When customizing lines, you can apply changes to all lines in the visual, or to a given series only (series editing):
- To apply changes to all lines, choose Default from the dropdown list (blue arrow below).
- To set changes for a specified series only, choose the series item instead. For example, choose Acme to alter the formatting for the Acme manufacturer only.
Component Ribbon
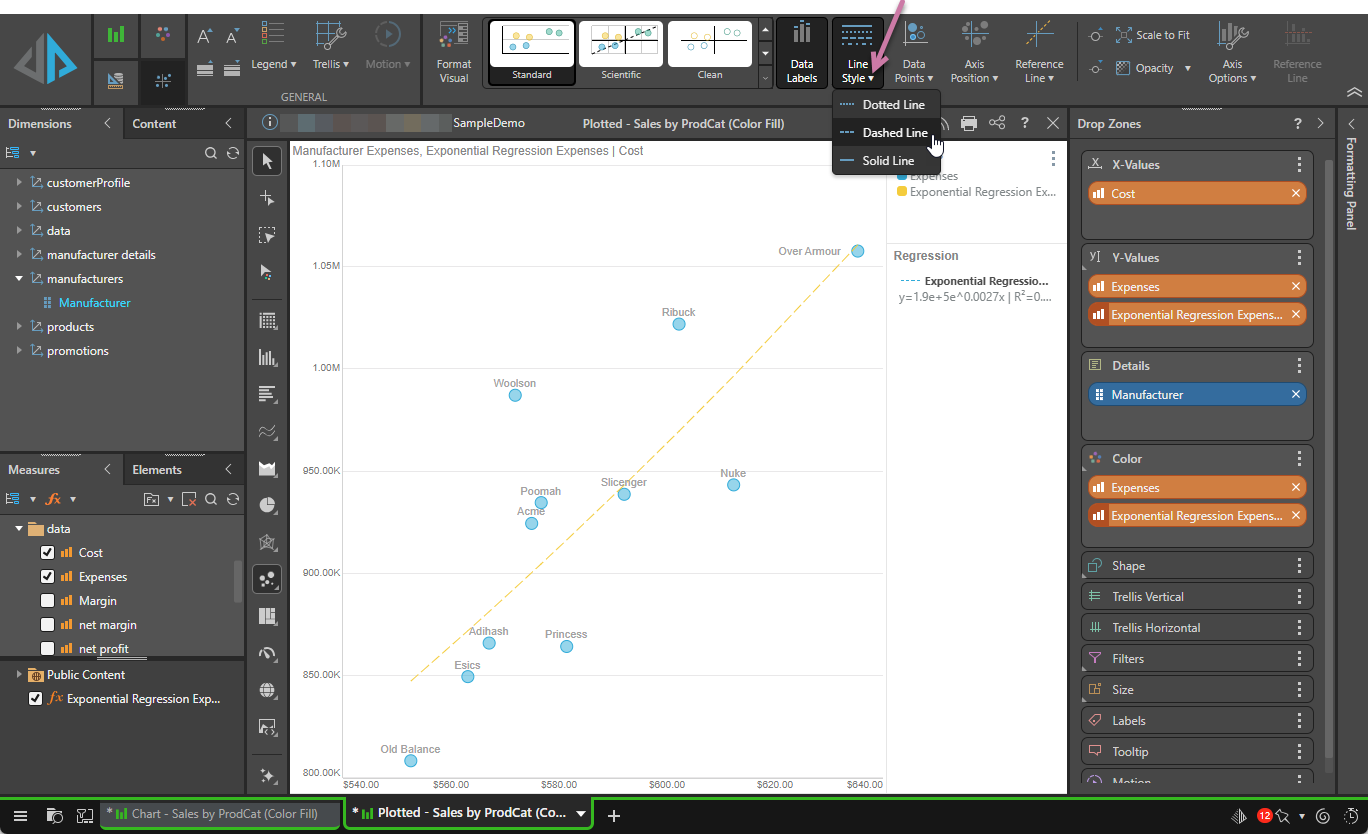
(Not Cartesian Charts.) Line style and line width can also be set from the Component ribbon. To set the line style, open the Line Style dropdown list (purple arrow below). To change the line width, use the Increase and Decrease Line Width buttons (orange highlight).
Plotted Charts
When working with plotted charts, the line style function is enabled from the Component ribbon only when a regression line is added to the chart.